Myelodysplastic syndromes (MDS) prognosis
Myelodysplastic syndromes (MDS): AML risk and survival
The information on this page talks about the average number of people that develop AML, and the average number of years people survive, in the different risk groups.
It’s important to remember that the numbers in this table are only averages take from large groups of patients. Many people lie outside of these numbers, and these numbers do not tell you what will happen to you individually.
Everyone is different. If you want to know about your individual prognosis, your healthcare team are the best people to ask. They know you and your individual situation.
The table below shows what the predicted clinical outcomes are for people with MDS with different risk scores.
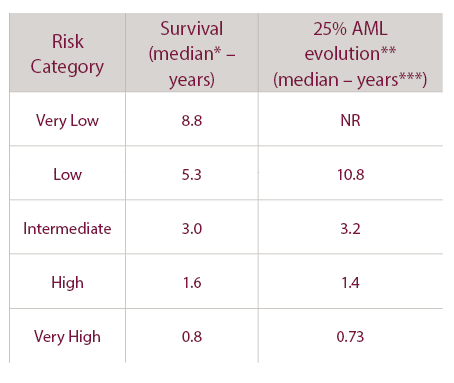
* median = The midpoint of data after being ranked from lowest to highest. This shows that half of patients survive less than this number of years, and half survive more than this number of years.
** This column (25% AML evolution) is the average length of time that it would take for one quarter of patients to develop AML in that IPSS-R group.
*** median = The midpoint of data after being ranked from lowest to highest. This shows that for the 25% of patients who do progress to AML, half of them would progress before this time period and half of them after it.